Overview
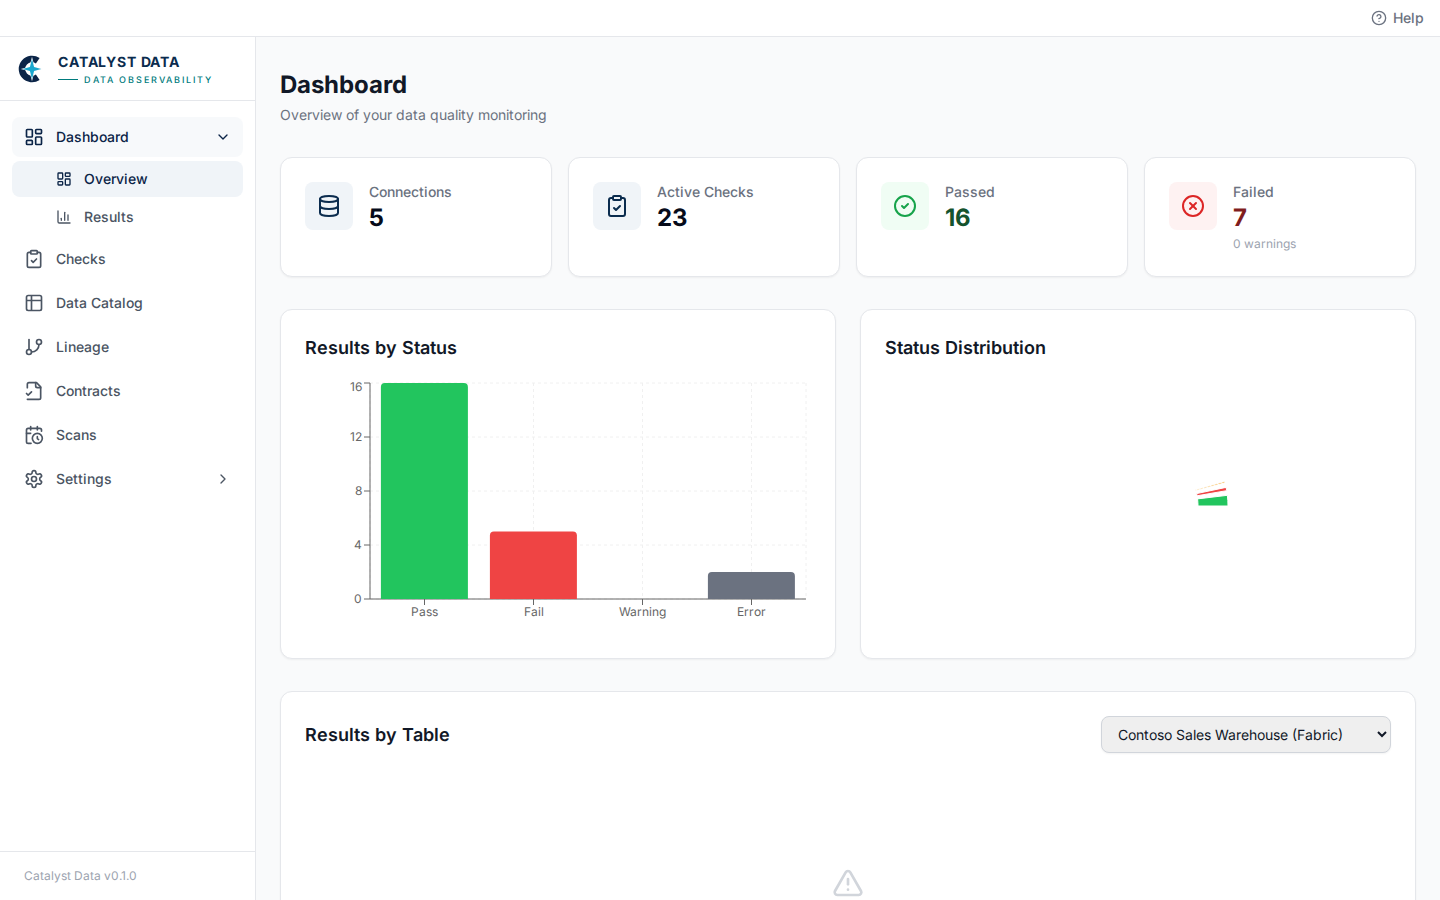
The Dashboard's Overview is the account-wide landing page — a running count of connections and active checks, a pass/fail/warning/error breakdown across every result so far, and a per-table result summary for the connection selected in the dropdown. It's the fastest way to answer "is anything broken right now?" without digging into Results.
The counts and charts cover every check that has ever run for your account, not just the most recent scan — check the Results page to filter down to a specific connection, table, or time range.